Let's cut through the noise. Asking if the stock market will recover in a specific future year, like 2026, is the wrong question. It frames investing as a binary event—win or lose, recover or crash—when the reality is a messy, non-linear process driven by psychology, policy, and profits. A true recovery isn't just prices hitting a new high; it's a sustained period where investor confidence, corporate earnings, and economic fundamentals realign. So, will we see that by 2026? The honest answer is that it depends entirely on a cocktail of factors we can only partially see today. But more importantly, your financial success shouldn't hinge on guessing that date correctly.
I've been through a few of these cycles. After the 2008 crash, everyone wanted to know "when" we'd get back to normal. The market bottomed in March 2009, but the psychological recovery for many investors took years longer. Some missed the entire rebound waiting for the "all clear" signal that never comes in a neat package.
What You'll Find in This Guide
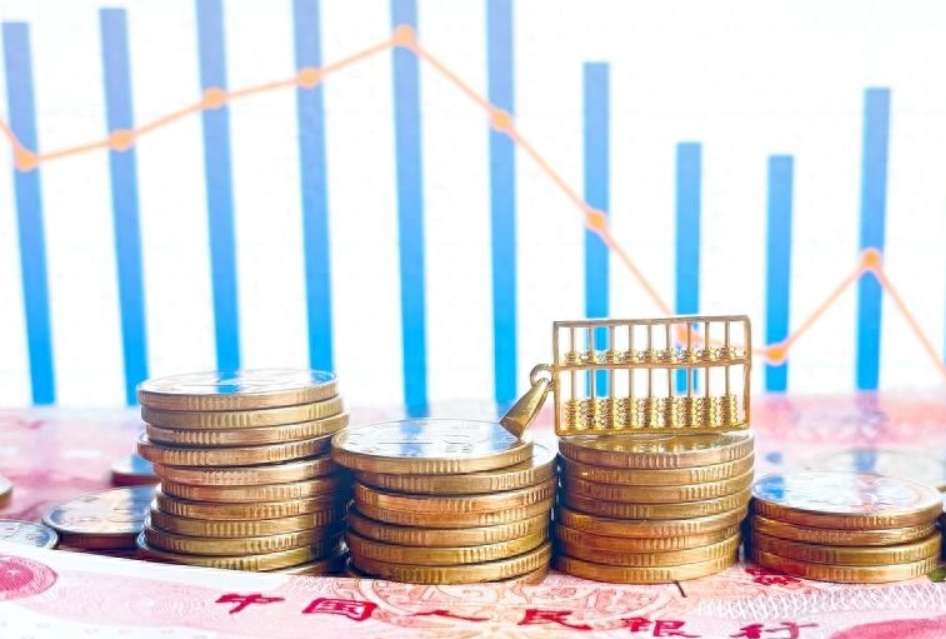
What History Teaches Us About Market Recoveries
Looking back is useful, but only if you know what to look for. The average bear market since World War II lasted about 14 months, with the S&P 500 falling roughly 36%. The average time to recover to the previous peak? About 27 months. But these are just averages—the reality is wildly inconsistent.
Take the dot-com bust. The S&P 500 peaked in March 2000. It didn't decisively break above that peak again until... April 2007. That's over seven years of sideways movement and false starts, even though the economy was growing for much of that period. Contrast that with the COVID-19 crash. The market plummeted 34% in a month and then roared back to new highs in just five months. The speed was unprecedented.
The lesson here isn't about averages. It's that the catalyst of the decline dictates the shape of the recovery. A crash caused by a sudden, external shock (like a pandemic) with a clear path to resolution can see a V-shaped recovery. A decline rooted in systemic excess (like the 2000 tech bubble or 2008 financial crisis) requires a long, painful process of deleveraging and rebuilding balance sheets. It's a grind.
My Take: Most investors obsess over the depth of the drop. I think the duration of the malaise is far more damaging to long-term plans. A quick, deep crash is easier to stomach and often provides a clearer buying opportunity. A slow, grinding decline that lasts years is what tests conviction and leads people to abandon their strategy at the worst possible time.
The Three Pillars That Will Make or Break the Next Recovery
Forget crystal balls. Focus on these three concrete pillars. Their interaction will set the timeline for any meaningful, sustained market recovery.
1. The Federal Reserve's Balancing Act
This is the big one. For the past two years, the Fed has been in inflation-fighting mode, raising interest rates at the fastest pace in decades. Higher rates slow the economy by making borrowing more expensive for companies and consumers. They also make "safe" assets like bonds more attractive relative to stocks.
The pivot point for markets will be when the Fed signals that its fight against inflation is decisively won and shifts toward supporting growth. This doesn't mean they'll slash rates to zero again. But a shift from tightening to a neutral, or even accommodative, stance is rocket fuel for market sentiment. Watch the dot plot and Fed Chair commentary like a hawk. Data from the Federal Reserve's own meetings and reports are your primary source here.
2. Corporate Earnings Growth
Stock prices ultimately follow earnings. A recovery can't be sustained on hope and low interest rates alone—companies need to start growing their profits again. We've seen earnings resilience in some sectors, but pressure on margins from higher wages and input costs is real.
The question for 2025 and 2026 is: Can S&P 500 companies return to solid, mid-single-digit or better earnings growth? This requires a stable economic backdrop where consumer demand holds up and companies have pricing power. Analysts are constantly revising estimates; look for trends in these revisions. A steady upward revision trend is a powerful leading indicator.
3. The Geopolitical and Economic Backdrop
This is the wild card. Supply chain reconfigurations, ongoing conflicts, and the trajectory of major economies like China and the EU create a layer of uncertainty. A stabilization or improvement here reduces a major headwind. A new crisis adds a headwind. It's that simple, and notoriously hard to predict.
Consider a hypothetical scenario: Let's say inflation is tamed by late 2024, and the Fed pauses. But then, a broader economic slowdown in Europe tips the US into a mild recession in 2025. The recovery in corporate earnings gets pushed out. In this case, a 2026 recovery becomes more about climbing out of that 2025 hole than continuing a 2024 rally.
| Potential 2025-2026 Scenario | Primary Driver | Likely Market Path | Key Action for Investors |
|---|---|---|---|
| "Soft Landing" Acceleration | Fed cuts rates gently; earnings grow steadily. | Strong, sustained recovery. New highs likely. | Stay invested. Consider tilting toward cyclical sectors. |
| "Growth Scare" Recession | Mild recession hits; earnings contract briefly. | Volatile, sideways grind followed by recovery. | Defensive positioning. Use volatility to add to high-quality names. |
| "Stagflation Lite" | Inflation stays sticky; Fed remains constrained. | Choppy, low-return environment. | Focus on dividend growers, value stocks, and real assets. |
How to Position Your Portfolio for a Potential 2026 Recovery
This is where we move from theory to practice. Your goal isn't to bet everything on a 2026 recovery. It's to build a portfolio that performs reasonably well in several outcomes and captures the upside if a recovery takes hold.
First, audit your risk tolerance—for real. Not the risk tolerance you had in a raging bull market. The one you have now, after recent volatility. If the thought of another 20% drop makes you panic-sell, your equity allocation is too high. Full stop. There's no shame in admitting that. A lower-equity portfolio that you can hold through a storm will always beat a "max growth" portfolio you abandon at the bottom.
Second, embrace strategic diversification. This means going beyond just US stocks and bonds.
- International Exposure: Developed international and emerging markets often trade at discounts and can be in different economic cycles. Data from the World Bank and IMF can highlight relative growth trends.
- Sector Rotation: In early recovery phases, cyclical sectors like financials, industrials, and consumer discretionary tend to lead. Technology often leads later in the cycle. Don't put all your eggs in one sector basket.
- Factor Tilts: Consider allocations to factors like quality (companies with strong balance sheets and stable earnings) and value. These have historically provided resilience.
Third, implement a ruthless dollar-cost averaging (DCA) plan. This is the most powerful tool you have when facing uncertainty. By investing a fixed amount at regular intervals (e.g., every month), you automatically buy more shares when prices are low and fewer when they are high. It removes emotion and timing from the equation. If you have a lump sum, consider spreading the investment over 6-12 months via DCA.
I made my biggest investing mistake in 2001 by trying to "wait for the bottom" after the tech wreck. I sat in cash, watched prices fall, and then was too scared to buy when things were truly cheap. I missed a huge portion of the subsequent recovery. DCA forces discipline I wish I'd had back then.


Comments
0